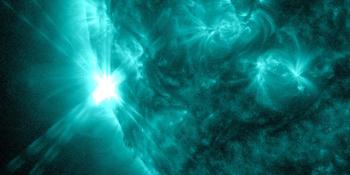
التوهج الشمسي
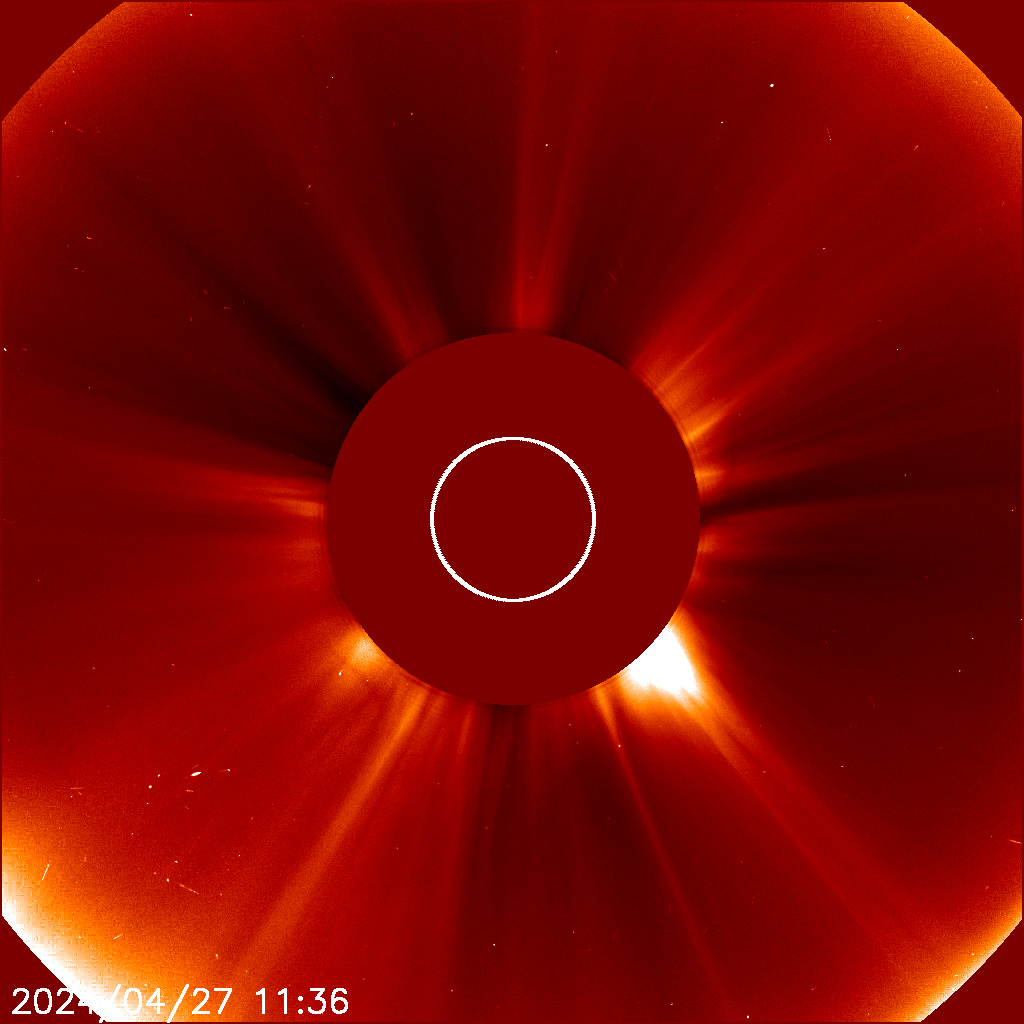
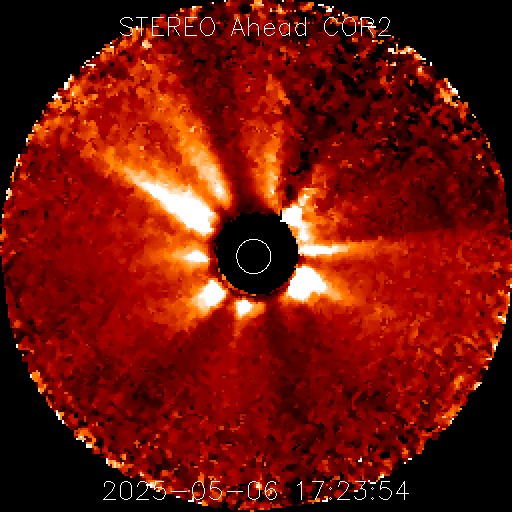
The plot on this page shows us the most recent 24-hour solar X-ray data from the primary GOES satellite. You can zoom in on this plot by selecting a time period that you wish to view and even export the graph as a JPG, PDF, SVG or PNG file. Beneath that we have a collection of live imagery which can be used to pinpoint the location of a solar flare and see if there was a coronal mass ejection. Last but not least we have a list detailing all solar flares that took place today. All times listed are in UTC.
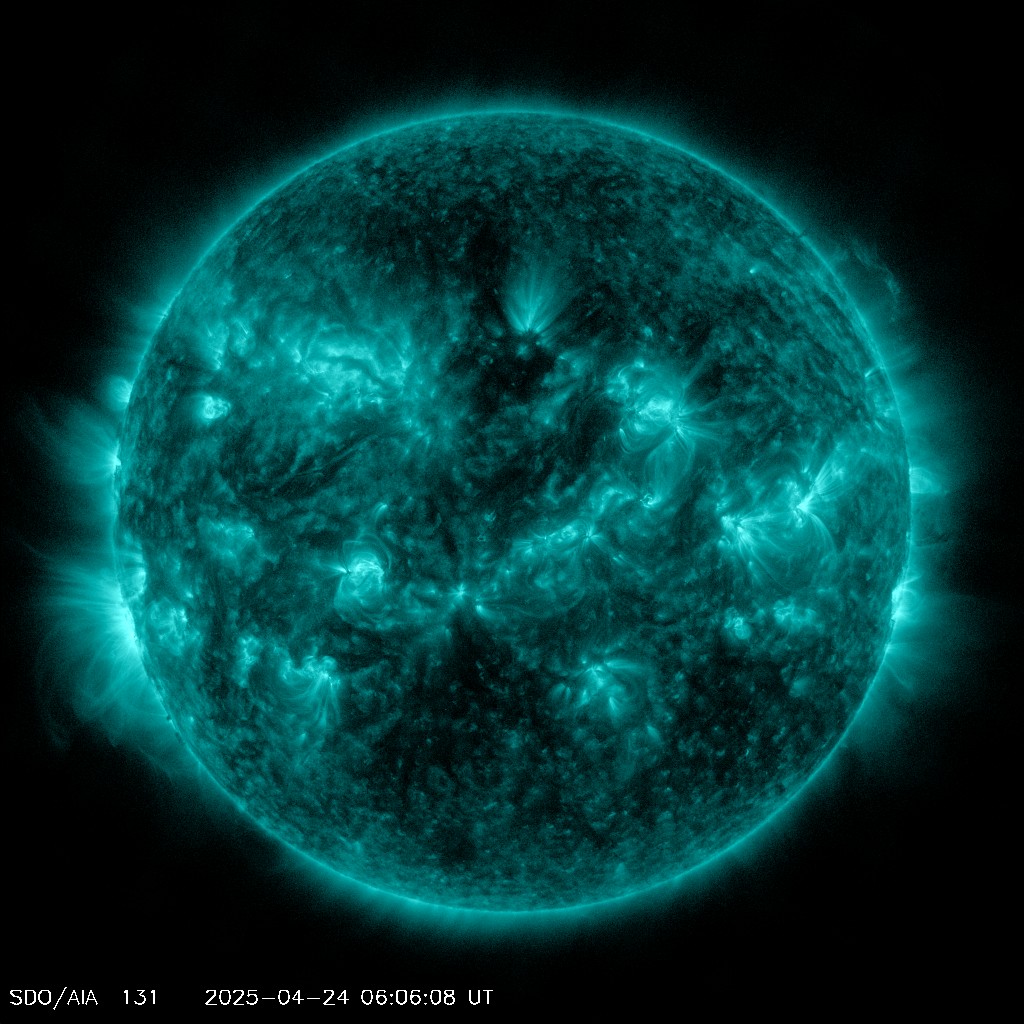
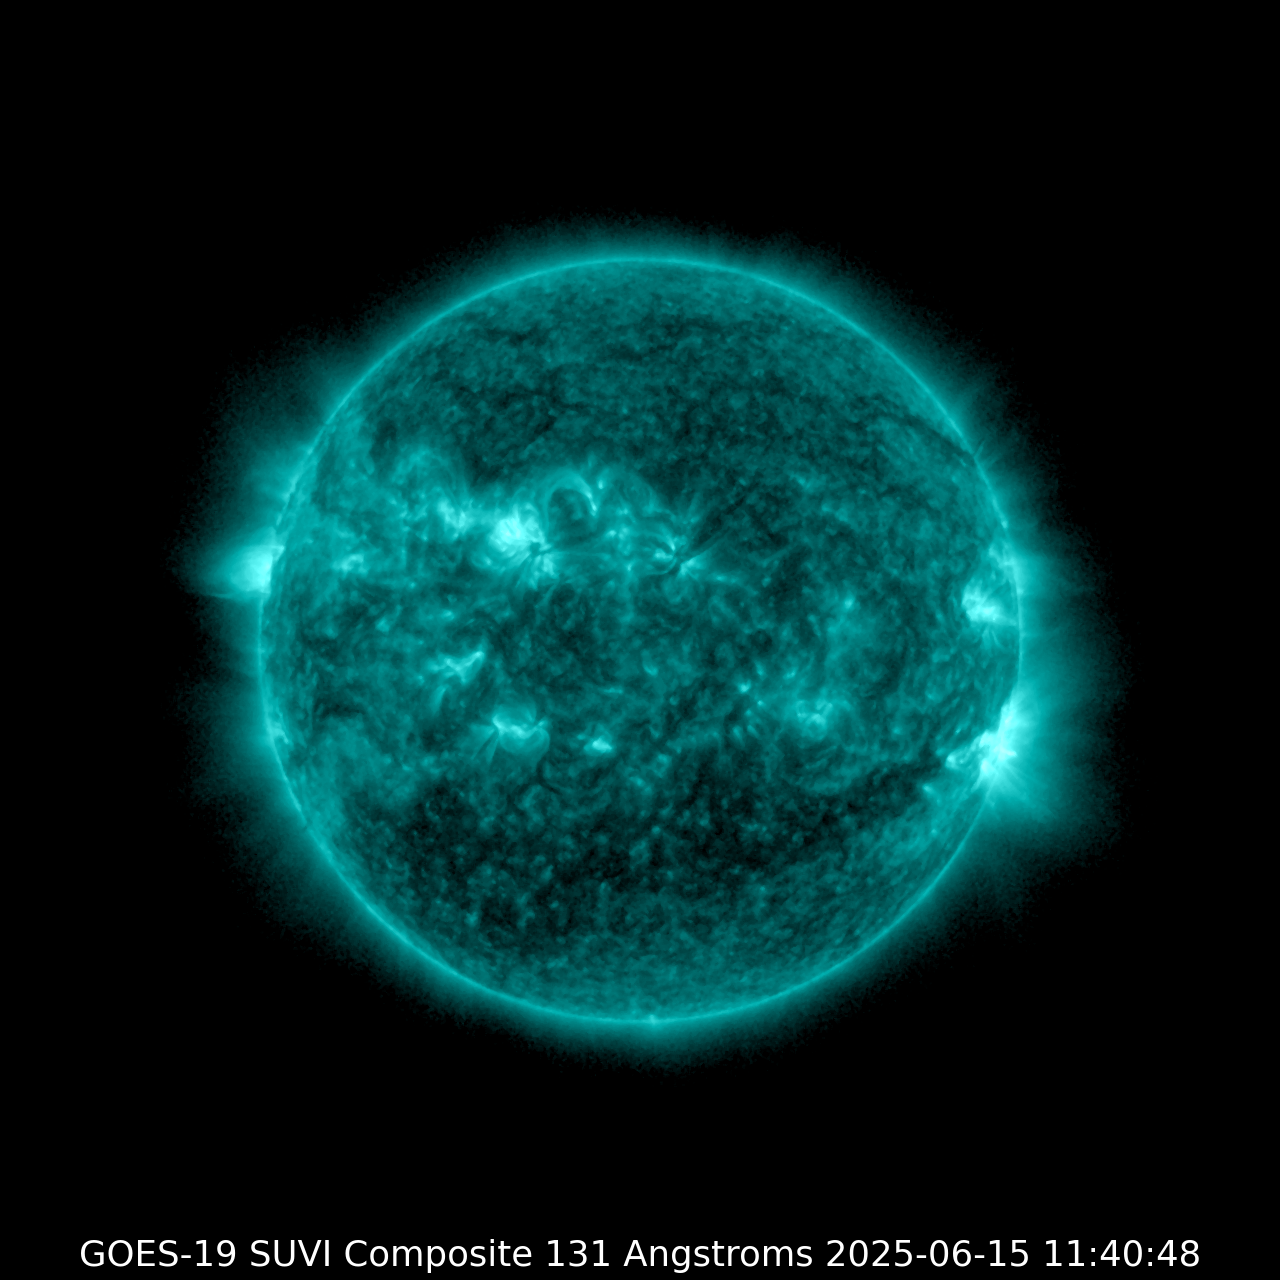
Today's Sun
| C-class solar flare | 99% |
| M-class solar flare | 30% |
| X-class solar flare | 5% |
Events on the Sun past 24 hours
More events in the archiveAll times in UTC
التوهج الشمسي |
Coronal mass ejections |
|---|---|
|
|
|
|
|
|
Radio Blackout

Latest news
Old sunspot region 3664 returns with an M9.3 solar flare!

CME impact, X1.5 solar flare

M9.3 solar flare, S3 proton storm, Earth-directed CME
Latest forum messages
Support SpaceWeatherLive.com!
A lot of people come to SpaceWeatherLive to follow the Sun's activity or if there is aurora to be seen, but with more traffic comes higher server costs. Consider a donation if you enjoy SpaceWeatherLive so we can keep the website online!

Space weather facts
| Last X-flare | 2024/06/10 | X1.55 |
| Last M-flare | 2024/06/25 | M1.0 |
| Last geomagnetic storm | 2024/06/28 | Kp8- (G4) |
| Spotless days | |
|---|---|
| Last spotless day | 2022/06/08 |
| Monthly mean Sunspot Number | |
|---|---|
| مايو ٢٠٢٤ | 171.7 +35.2 |
| يونيو ٢٠٢٤ | 153.9 -17.8 |
| Last 30 days | 152.9 +8.3 |