Kiruna magnetometer
This magnetometer gives you the values of the magnetometer stationed at The Swedish Institute of Space Physics in Kiruna, Sweden. It is often used in Europe to see if there is chance for aurora right now. If you are located outside Europe you should find another magnetometer which is closer to your location.
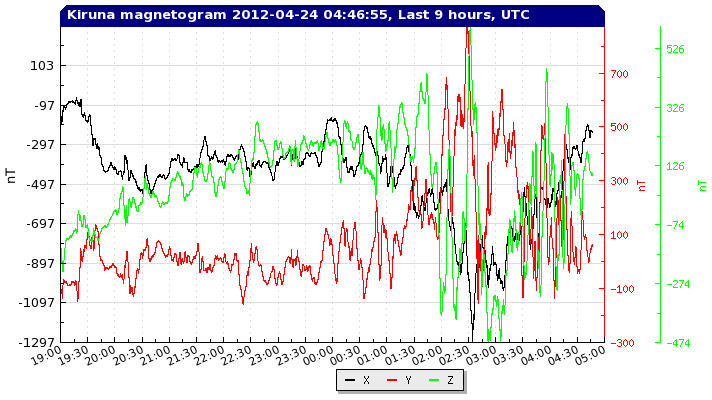
But how do we read this plot? The plot displays the X, Y and Z values that are being observed at the magnetometer in Kiruna. The line of interest is the black line. It represents the X-component which represents the magnetic field strength in roughly the direction of the north magnetic pole. When the Earth's magnetic field is calm and the geomagnetic conditions are at very quiet levels we will see a value of about 10685 nanoTesla (nT) for the X-component on the Kiruna magnetometer. However, when the magnetic field becomes disturbed due to enhanced space weather conditions, we will see that the values on the graph will start to fluctuate and those values are important for us to determine if there is a chance to see the aurora. During geomagnetic storming when Kiruna is on the day light side of the Earth, the Kiruna magnetometer could show deflections higher than the baseline of 10685nT. This is normal because on the day light side of Earth, the magnetic field is being compressed by the incoming solar wind.
For the lower European middle latitudes like the southern England, Belgium, and central Germany you might be able to capture photographic aurora (not visible with the naked eye) when there is a deflection of at least 700nT on the Kiruna magnetometer. Visual aurora (visible with the naked eye) can be expected when the deflection is 1300nT or more. We understand that this might be complicated to understand so let's work with two examples.
At middle latitudes locations, like Belgium and The Netherlands, the most common form of aurora that we might see sometimes, are weak aurorae low on the northern horizon which might be hard to see with the naked eye. A good example of how the Kiruna magnetogram would look like in such a situation can be seen on the picture below. The deflection was about 1200nT and the predicted Kp-index at that moment was 7. We can conclude that weak visual aurora was possible for northern parts of The Netherlands and Germany.
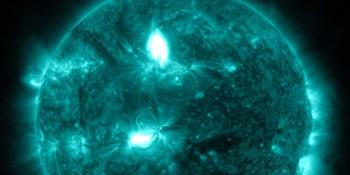
A second (rather extreme) example is this magnetogram from 30 October 2003. Two coronal mass ejections from a X17 and X11 solar flare arrived at Earth and caused extremely severe geomagnetic storming with aurora which could be seen all the way in Portugal, Europe and Florida in the United States! At all middle latitude locations, the aurora was seen directly overhead! These storms will always be remembered as the "Halloween Storms of 2003" and were the strongest geomagnetic storms of SolarCycle 23 with a Kp-index of 9.
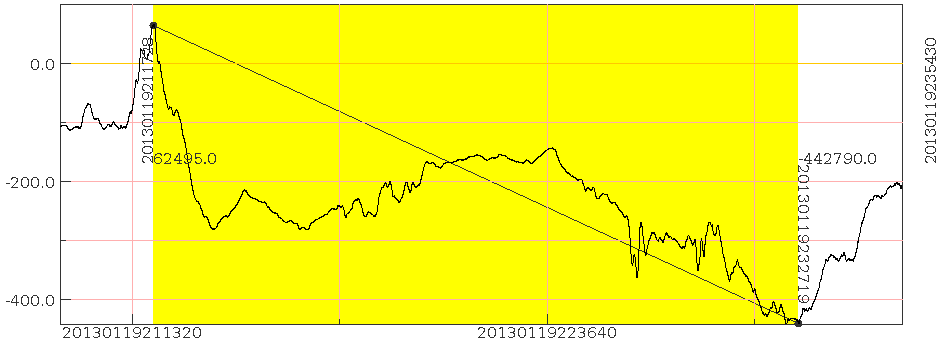
But how do we determine this deflection? When Earth's magnetic field get's disturbed, the magnetometers will react to it and thus the Kiruna magnetogram will show us minor deflections from the normal quiet level of 10650nT. This deflection is also expressed in nanoTesla units (nT). The start of this deflection occurs during the onset of a geomagnetic storm before the measured values start to drop. It's difficult to explain this in words so in the graph below you'll see a good example of a deflection, measured at the Kiruna station. The deflection is shown as a yellow area in the graph; it starts shortly with a spike after the arrival of the coronal mass ejection before it reaches it's lowest point. This deflection, expressed in nanoTesla, is the value we have to look at if we want to see or photograph the aurora. In this example the deflection is around 500nT and that is associated with a local Kiruna K-indice of 6 and thus was this not enough for aurora on the lower middle latitudes.
Interpreting the K-index based on values from Kiruna
The K-index is just like the Kp-index, a geomagnetic storm index with a logarithmic scale from 1 to 9. The Kp-index is a planetary index combining the magnetometers values from multiple locations around the world where the K-index only comes from one single magnetometer station. Based on the deflection that we can calculate from the graph provided by the Swedish Institute of Space Physics (IRF) we can try to determine the K-indice for the magnetometer in Kiruna, Sweden. For this specific station in Kiruna, we do this with the help of the table below. Be aware that, due to it's location, this magnetometer is only helpful for observers from Europe. If you are located outside of Europe we recommend you find another magnetometer closer to your location. Also note that this table can only be used for the magnetometer from Kiruna! You can not use this table for other magnetometers!
| K-index | Böjning i nanoTesla | Stormtyp |
|---|---|---|
| 0 | 0 - 15 | Tysta förhållanden |
| 1 | 15 - 30 | Tysta förhållanden |
| 2 | 30 - 60 | Tysta förhållanden |
| 3 | 60 - 120 | Oroliga geomagnetiska förhållanden |
| 4 | 120 - 210 | Aktiva geomagnetiska förhållanden |
| 5 | 210 - 360 | G1 - Svag geomagnetisk storm |
| 6 | 360 - 600 | G2 - Måttlig geomagnetisk storm |
| 7 | 600 - 990 | G3 - Stark geomagnetisk storm |
| 8 | 990 - 1500 | G4 - Svår geomagnetisk storm |
| 9 | 1500 and more | G5 - Extrem geomagnetisk storm |
<< Tillbaka till föregående sida
Senaste nytt
X1.1 solar flare with earth-directed CME
Sunspot region 3615, G1 watch
X6.3 solar flare
Senaste inläggen
Stöd SpaceWeatherLive.com!
För att vara tillgängliga vid stora norrskensutbrott måsta vi ha kraftiga servrar som kan hantera alla besökare. Donera och stöd vårt projekt, så att vi kan finnas online även under stora stormar!
Rymdvädersfakta
| Senaste X-utbrottet | 2024/03/28 | X1.1 |
| Senaste M-utbrottet | 2024/04/17 | M1.6 |
| Senaste geomagnetiska stormen | 2024/04/16 | Kp5 (G1) |
| Fläckfria dagar | |
|---|---|
| Senaste dag utan solfläckar | 2022/06/08 |
| Månadsvis faktiskt antal solfläckar | |
|---|---|
| mars 2024 | 104.9 -19.8 |