Historical solar cycles
The chart on this page shows the sunspot numbers since 1749. That's when the extensive recording of solar sunspot activity began. You can zoom in on this plot by selecting a time period that you wish to view. Every dataset can be toggled on or off by clicking on the corresponding description under each graph and it can be exported as a JPG, PNG, PDF or SVG file.
Comparing solar cycles
The chart below lets you compare several solar cycles with each other to see how the several solar cycles differ with each other and see how the current solar cycle progresses in relation to other solar cycles. The chart is shown with the current and last solar cycle, you can show/hide any solar cycle by clicking/tapping in the legend below the chart.
Latest news
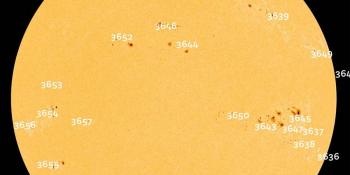
Lot's of sunspots! Big chance for major flare activity?
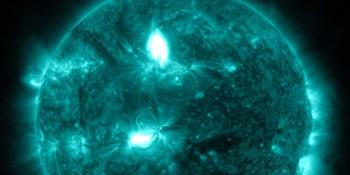
X1.1 solar flare with earth-directed CME
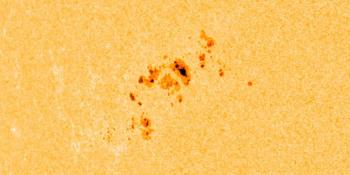
Sunspot region 3615, G1 watch
Latest forum messages
Support SpaceWeatherLive.com!
A lot of people come to SpaceWeatherLive to follow the Sun's activity or if there is aurora to be seen, but with more traffic comes higher server costs. Consider a donation if you enjoy SpaceWeatherLive so we can keep the website online!

Space weather facts
| Last X-flare | 2024/03/28 | X1.1 |
| Last M-flare | 2024/04/25 | M1.3 |
| Last geomagnetic storm | 2024/04/19 | Kp7 (G3) |
| Spotless days | |
|---|---|
| Last spotless day | 2022/06/08 |
| Monthly mean Sunspot Number | |
|---|---|
| March 2024 | 104.9 -19.8 |
| Last 30 days | 135.5 +27.6 |