Solar Cycle progression
These charts on this page resemble the progress of the solar cycle. The charts are updated every month by the SWPC with the latest ISES predictions. Observed values are initially temporary values that are replaced with the final data once it is available. All the graphs on this page can be exported as JPG, PNG, PDF or SVG files. Every dataset can be toggled on or off by clicking on the corresponding description under each graph.
Number of C, M and X-class solar flares per year
The graph below shows us the number of C, M and X-class solar flares that occur for any given year. It gives us a nice idea of the amount of solar flares in relation to the sunspot number. It is thus another way of seeing how a solar cycle evolved over time. This data comes from the NOAA SWPC and is updated daily.
The graph below shows you the number of C, M and X-class solar flares that were produced during past month together with the sunspot number of each day. This gives you an idea of the solar activity during the past month. This data comes from the NOAA SWPC and is updated daily.
The Butterfly Diagram
Throughout the solar cycle, the latitude of sunspot regions varies with an interesting pattern. The graph below shows the latitude of all sunspot regions of the last 22 years versus the time (in years). Sunspots are typically confined between -35° south and +35 degrees north latitude. At the beginning of a new solar cycle, sunspot regions are formed at a higher latitudes, but as the cycle progresses towards the maximum, the sunspot regions gradually form at lower latitudes. When nearing the solar minimum, the sunspot regions appear around the solar equator and as a new cycle starts again, sunspots of the new cycle will start to emerge at a high latitude. This recurrent behaviour of sunspots give rise to the 'Butterfly' pattern and was first discovered by Edward Maunder in 1904. The graph is updated every month.
Number of spotless days per year
During periods of low solar activity, the Sun can be devoid of any sunspots and thus be spotless. This is a frequent occurrence in the years around and during solar minimum. The graph below shows how many days during a specific year that the earth-facing side of the Sun had no sunspots.
Number of days with a geomagnetic storm per year
The graph below shows the number of days with a geomagnetic storm per year and how strong those storms were. This will give you an idea in which years there were a lot of geomagnetic storms.
Latest news
Lot's of sunspots! Big chance for major flare activity?
X1.1 solar flare with earth-directed CME
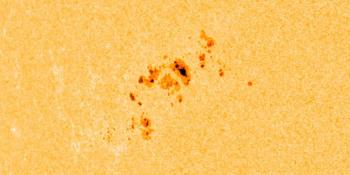
Sunspot region 3615, G1 watch
Latest forum messages
Support SpaceWeatherLive.com!
A lot of people come to SpaceWeatherLive to follow the Sun's activity or if there is aurora to be seen, but with more traffic comes higher server costs. Consider a donation if you enjoy SpaceWeatherLive so we can keep the website online!

Space weather facts
| Last X-flare | 2024/03/28 | X1.1 |
| Last M-flare | 2024/04/25 | M1.3 |
| Last geomagnetic storm | 2024/04/19 | Kp7 (G3) |
| Spotless days | |
|---|---|
| Last spotless day | 2022/06/08 |
| Monthly mean Sunspot Number | |
|---|---|
| March 2024 | 104.9 -19.8 |
| Last 30 days | 135.5 +27.6 |