G1 storm, Incoming CME?
Tuesday, 21 March 2017 23:39 UTC
We reached the minor G1 geomagnetic storm threshold today thanks to the arrival of the anticipated coronal hole solar wind stream. The solar wind speed fluctuates around 600km/s and the direction of the IMF (Bz) is variable but does occasionally tip southward down to -10nT. These stats are very decent so a minor G1 geomagnetic storm watch remains in effect for the remainder of this day and tomorrow, 22 March 2017. There is however more to report so keep on reading!
Incoming coronal mass ejection?
While looking at our website to report about the coronal hole solar wind stream, our eyes spotted something interesting: a steady rise in the low energy protons as measured by the trusty ACE EPAM instrument. Below you see the ACE EPAM graph which shows us the slowly increasing amount of low energy protons at L1. Look at the bottom lines which are colored red, orange, yellow, white and green.
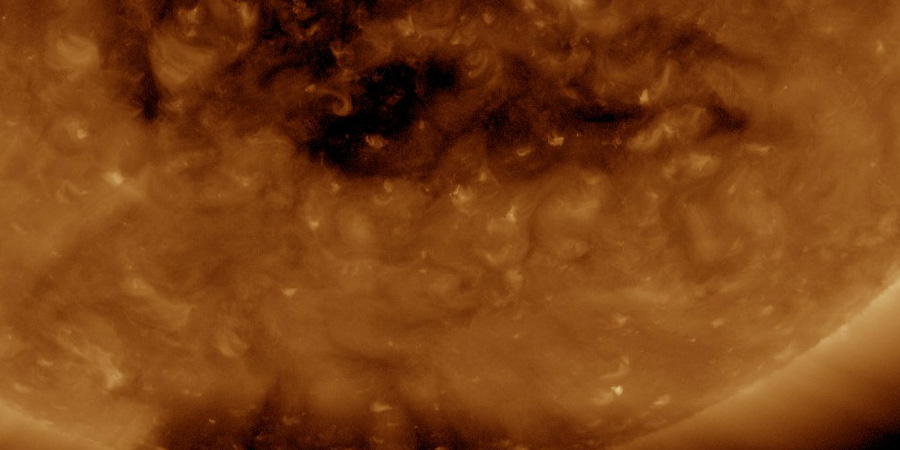
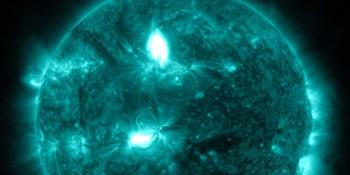
I hear you ask: why is this significant? Well, this is a classic sign of an approaching shock wave from an interplanetary magnetic cloud. In fact, we were aware of the solar eruption which took place back on 19 March from an area south of the earth-facing coronal hole (see the header image) however the cloud is very faint on the images from the SOHO LASCO coronagraph. A faint partial halo can be spotted but the plasma cloud looks to be heading mostly south of the ecliptic. We originally choose to not mention it because we thought there would be a decent chance that the plasma cloud would miss us and/or hardly be noticeable once it arrives but now that the low energy protons are on the rise, we might have underestimated the situation and that it is indeed likely that we will see a glancing blow at Earth. The SOHO/LASCO C2 animation below shows the coronal mass ejection as it leaves the Sun. You have to look very closely, it is not easy to spot!
If you managed to spot the coronal mass ejection, you can see it is almost a 180 degree halo so there is indeed a decent chance that we are going to see a glancing blow but the bulk is heading well south of the ecliptic. It is however a very faint and slow plasma cloud so any impact at Earth is likely to be minor. The plasma cloud is not traveling any faster than the ambient solar wind so its remarkable we see its signature on the ACE EPAM plot. However, we must conclude we might see an enhancement in the IMF sometime in the coming days, likely on 24 March. We are not going to say this will cause a geomagnetic storm but coronal mass ejections are always worth keeping an eye out for as they are often much stronger or weaker than originally expected. Something to watch out for if you are a real space weather die hard!
Thank you for reading this article! Did you have any trouble with the technical terms used in this article? Our help section is the place to be where you can find in-depth articles, a FAQ and a list with common abbreviations. Still puzzled? Just post on our forum where we will help you the best we can!
Latest news
Lot's of sunspots! Big chance for major flare activity?
X1.1 solar flare with earth-directed CME
Sunspot region 3615, G1 watch
Latest forum messages
Support SpaceWeatherLive.com!
A lot of people come to SpaceWeatherLive to follow the Sun's activity or if there is aurora to be seen, but with more traffic comes higher server costs. Consider a donation if you enjoy SpaceWeatherLive so we can keep the website online!

Space weather facts
| Last X-flare | 2024/03/28 | X1.1 |
| Last M-flare | 2024/04/24 | M1.6 |
| Last geomagnetic storm | 2024/04/19 | Kp7 (G3) |
| Spotless days | |
|---|---|
| Last spotless day | 2022/06/08 |
| Monthly mean Sunspot Number | |
|---|---|
| March 2024 | 104.9 -19.8 |
| Last 30 days | 124.7 +19.1 |