Frequently Asked Questions (FAQ)

One of the most important missions we have here on SpaceWeatherLive is that our visitors learn about space weather when they visit our website. That is exactly the reason why we have a large help section with many articles where we dig deeper in the world of space weather. However, we still receive a lot of questions here on SpaceWeatherLive and some of these questions return every so often. The questions we receive the most often can now be found in this FAQ.

Solar activity

We don’t know. There are people and even scientists who claim that the Sun is heading for a new Maunder Minimum. The Maunder Minimum was a period of about 70 years between 1645 and 1715 when very few sunspots appeared on the solar disk. While it is true that solar cycle 24 has been much less active than what we’re used to considering of the past few decades, we do not yet have an accurate way to predict solar activity so far in advance. It cannot be said right now if the Sun is about to enter a long lasting period of exceptional quietness. At the time of writing, Solar Cycle 25 is expected to about as strong or slightly stronger than Solar Cycle 24.

Solar flares can not only differ dramatically in strength but also in duration. Some solar flares last for hours and others last only a couple of minutes. Long duration solar flares are often (but not always!) accompanied by an ejection of solar plasma. This is what we call a coronal mass ejection. Solar flares that aren’t very long in duration (impulsive) can still launch a coronal mass ejection but this is fairly rare, and if they do, these coronal mass ejections are often not as strong as coronal mass ejections that are launched during long duration events.

There isn’t an exact time limit that a solar flare needs to reach in order for it to be classified as a long duration event but the American NOAA SWPC classifies a solar flare as a long duration event if the solar flare is still in progress 30 minutes after it started.

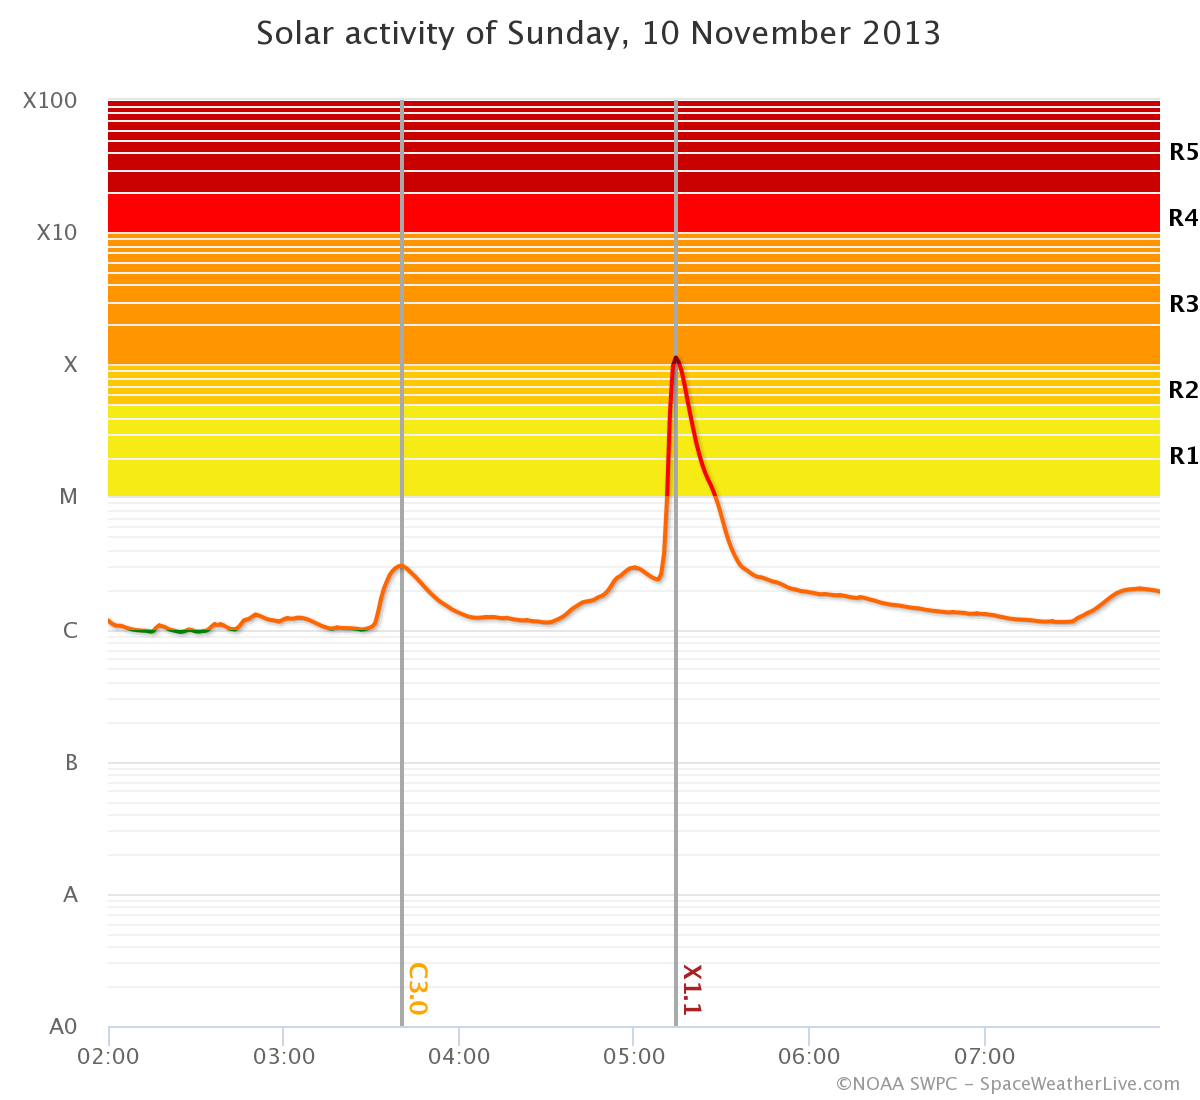
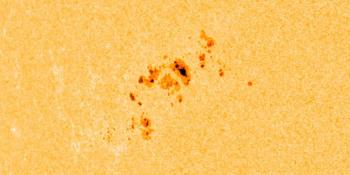
Image: Example of an impulsive solar flare.

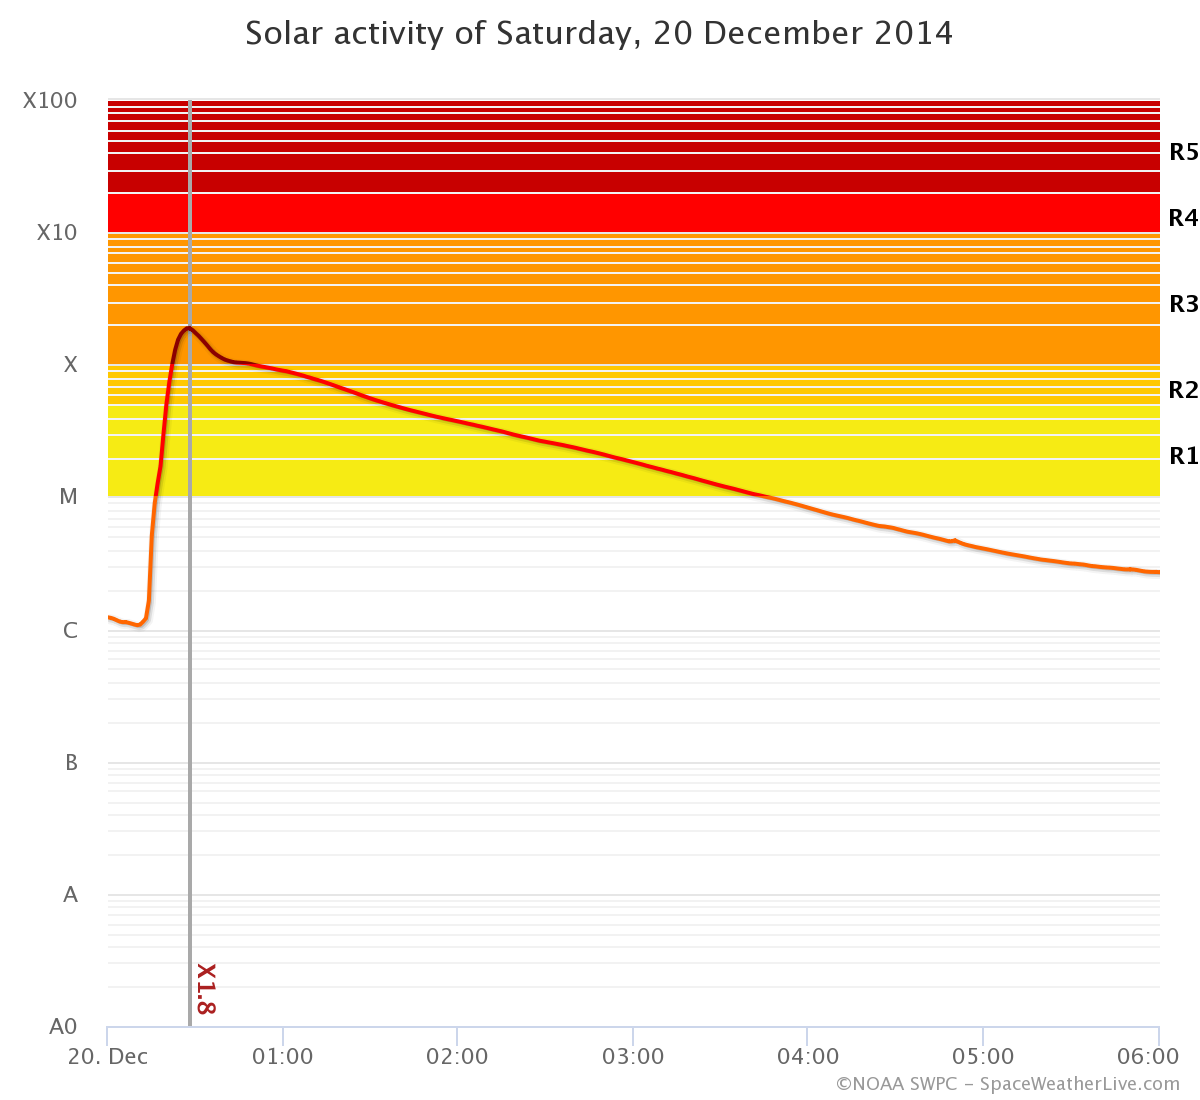
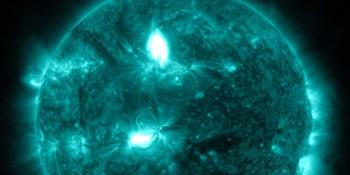
Image: Example of a long duration solar flare.

During solar eruptions, the Sun often emits large amounts of protons and electrons. These protons are flung out in all directions but a good bit of them follow the magnetic field lines of the interplanetary magnetic field. Because the Sun spins on her own axis, the interplanetary magnetic field forms a shape which you could compare to ballerina’s skirt. This is what we call the Parker spiral. Because of the Parker spiral, protons launched from areas near or even behind the west limb can reach Earth.

Image: The Parker Spiral.

NASA’s Solar Dynamics Observatory is in a geosynchronous orbit around our planet. From there it normally has an uninterrupted view of the Sun. However, twice a year near the equinoxes the Earth blocks SDO’s view of the Sun for a period of time each day. These eclipses are fairly short near the beginning and end of these three week eclipse seasons but ramp up to 72 minutes in the middle. If you see an image from SDO that is completely black then you are likely looking at Earth!

Sometimes you might be lucky enough to see a much smaller object on the images from NASA’s Solar Dynamics Observatory: the Moon! The Moon can also appear on images from NASA’s Solar Dynamics Observatory but it will never block the entire Sun for a very long time like Earth does.

Animation: The Earth blocks SDO’s view of the Sun.

Animation: The Moon blocks SDO’s view of the Sun.

Just like SDO, some data dropouts will occur during satellite eclipses when the Moon or Earth comes between the satellite and the Sun. This is especially common during the spring and fall. The eclipse season lasts for about 45 to 60 days and the data dropouts ranges from minutes to just over an hour.
Solar flares are basically intense but very localized explosions on our Sun which emit a lot of electromagnetic radiation in Ultraviolet and X-rays. Solar flares normally do not emit electromagnetic radiation in the visible spectrum (which we experience as light) but on very rare occasions solar flares can emit light in the visible spectrum as well. When this occurs, we call a solar flare a white-light solar flare. This is a rare occurrence and it is still not fully understood. White-light solar flares are often among the strongest solar flares ever observed. However, the amount of visible light emitted by a white-light solar flare is minuscule compared to the brightness of the Sun itself so don’t expect to see the Sun getting visibly brighter while standing on Earth when a white-light solar flare occurs!

To determine the magnetic polarity of sunspots and a sunspot group’s magnetic classification we use magnetogram imagery from the SDO/HMI instrument. This is a line-of-sight magnetogram even though the magnetic field of the Sun is 3D. This makes it impossible to accurately determine a sunspot region’s magnetic layout near the limbs due to projection effect as the polarity of sunspots seem to change near the limbs.

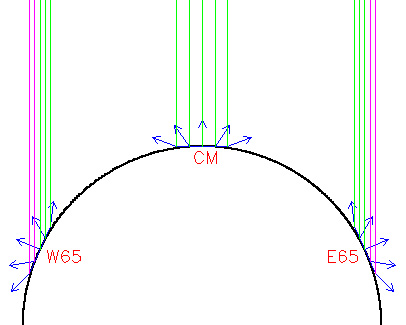
Image: Projection effect.

No. Almost all of the coronal mass ejections that arrive at Earth do not cause any noteworthy problems. While it is true that very strong coronal mass ejections can cause numerous issues with our modern technology like satellites and high voltage power lines, we are much better prepared for such events these days than we we’re just decades ago. The famous Halloween solar storms of 2003 were the most powerful geomagnetic storms in modern history and while this solar storm did cause some minor issues like the (temporary) loss of some satellites and a short power blackout in southern Sweden, we should not worry that a solar storm, no matter how strong, could throw us back to the dark ages.

Difference images are created by subtracting one image from the foregoing picture. This shows what has changed from one frame to the other and are commonly used when analyzing solar events. Coronal mass ejections and their exact trajectory can sometimes be hard to spot using regular imagery making difference imagery often an invaluable tool. Solar eruptions are also much easier to spot and analyze with difference imagery.

Animation: Difference imagery from SDO of an eruption in 2015.

Animation: Difference imagery from SOHO/LASCO of a coronal mass ejection in 2017.

No they do not. Active regions only receive a number when they are on the Earth-facing solar disk and only if they are accompanied by sunspots. We also can not see with the help of the STEREO satellites if an active region on the far side of the Sun has sunspots or not. STEREO is only able to see the Sun in extreme ultraviolet light which does not make it possible to see if an active region contains any sunspots.
Yes. Active regions get numbered by NOAA once they appear on the Earth-facing solar disc but only if they are accompanied by sunspots. If an active region survives one (or sometimes more!) solar rotations it will be given multiple numbers.

Auroral activity

No. First you need to understand that a solar flare doesn’t cause aurora. Solar flares can launch large clouds of solar plasma which we call coronal mass ejections and it is these coronal mass ejections that can produce aurora when they arrive at our planet. We also need to know that not every solar flare launches a coronal mass ejection. In fact, most solar flares do not! If we do have a strong and eruptive solar flare, it also needs to come from a sunspot region that is close to the center of the Earth-facing solar disk or else there is a risk that the coronal mass ejection is launched in a direction away from Earth. While the light of a solar flare takes just 8 minutes to reach our planet, these coronal mass ejections travel at much slower speeds. Very fast coronal mass ejections can travel the Sun-Earth distance in just one day but these are very rare. Most coronal mass ejections take two to four days to arrive at Earth.
There are no accurate ways to predict hours in advance where aurora might be seen and also not at what exact time. The auroral oval is normally at its thickest around local midnight but of course the solar wind conditions at Earth also need to be favorable for aurora at your specific location. It is not impossible to see aurora early in the evening or close to morning if the solar wind conditions are favorable enough for your location. You can only accurately estimate if there will be chance for aurora at your location about 1 hour in advance. The Deep Space Climate Observatory (DSCOVR) satellite that measures the solar wind and interplanetary magnetic field parameters is located between the Sun and the Earth and it takes the solar wind anywhere from 30 minutes to about an hour to travel the distance from DSCOVR to Earth. Taking a look at the parameters measured by DSCOVR is always a great start if you wish to know if there will be a chance for aurora at your location in the near future. Want to know if there is chance at this exact moment? Then we recommend taking a look at a local magnetometer.

Any location on the high latitudes will be able to see auroras with a Kp of 4. For any location on the middle latitudes a Kp-value of 7 is needed. The low latitudes need Kp-values of 8 or 9. The Kp-value that you need of course depends on where you are located on Earth. We made a handy list which is a good guide for what Kp-value you need for any given location within the reach of the auroral ovals.

Important! Note that the locations below give you a reasonable chance to see auroras for the given Kp-index provided local viewing conditions are good. This includes but is not limited to: a clear sight towards the northern or southern horizon, no clouds, no light pollution and complete darkness.

KpVisible from
0

North America:
Barrow (AK, United States) Yellowknife (NT, Canada) Gillam (MB, Canada) Nuuk (Greenland)

Europe:
Reykjavik (Iceland) Tromsø (Norway) Inari (Finland) Kirkenes (Norway) Murmansk (Russia)

1

North America:
Fairbanks (AK, United States) Whitehorse (YT, Canada)

Europe:
Mo I Rana (Norway) Jokkmokk (Sweden) Rovaniemi (Finland)

2

North America:
Anchorage (AK, United States) Edmonton (AB, Canada) Saskatoon (SK, Canada) Winnipeg (MB, Canada)

Europe:
Tórshavn (Faroe Islands) Trondheim (Norway) Umeå (Sweden) Kokkola (Finland) Arkhangelsk (Russia)

3

North America:
Calgary (AB, Canada) Thunder Bay (ON, Canada)

Europe:
Ålesund (Norway) Sundsvall (Sweden) Jyväskylä (Finland)

4

North America:
Vancouver (BC, Canada) St. John's (NL, Canada) Billings (MT, United States) Bismarck (ND, United States) Minneapolis (MN, United States)

Europe:
Oslo (Norway) Stockholm (Sweden) Helsinki (Finland) Saint Petersburg (Russia)

5

North America:
Seattle (WA, United States) Chicago (IL, United States) Toronto (ON, Canada) Halifax (NS, Canada)

Europe:
Edinburgh (Scotland) Gothenburg (Sweden) Riga (Latvia)

Southern Hemisphere:
Hobart (Australia) Invercargill (New Zealand)

6

North America:
Portland (OR, United States) Boise (ID, United States) Casper (WY, United States) Lincoln (NE, United States) Indianapolis (IN, United States) Columbus (OH, United States) New York City (NY, United States)

Europe:
Dublin (Ireland) Manchester (United Kingdom) Hamburg (Germany) Gdańsk (Poland) Vilnius (Lithuania) Moscow (Russia)

Southern Hemisphere:
Devonport (Australia) Christchurch (New Zealand)

7

North America:
Salt Lake City (UT, United States) Denver (CO, United States) Nashville (TN, United States) Richmond (VA, United States)

Europe:
London (England) Brussels (Belgium) Cologne (Germany) Dresden (Germany) Warsaw (Poland)

Southern Hemisphere:
Melbourne (Australia) Wellington (New Zealand)

8

North America:
San Francisco (CA, United States) Las Vegas (NV, United States) Albuquerque (NM, United States) Dallas (TX, United States) Jackson (MS, United States) Atlanta (GA, United States)

Europe:
Paris (France) Munich (Germany) Vienna (Austria) Bratislava (Slovakia) Kiev (Ukraine)

Asia:
Astana (Kazakhstan) Novosibirsk (Russia)

Southern Hemisphere:
Perth (Australia) Sydney (Australia) Auckland (New Zealand)

9

North America:
Monterrey (Mexico) Miami (FL, United States)

Europe:
Madrid (Spain) Marseille (France) Rome (Italy) Bucharest (Romania)

Asia:
Ulan Bator (Mongolia)

Southern Hemisphere:
Alice Springs (Australia) Brisbane (Australia) Ushuaia (Argentina) Cape Town (South Africa)

There can be multiple reasons for such a large difference between NOAA’s predicted Kp-index and the Kp that is being observed right now. The most common reason is that NOAA predicts that a coronal mass ejection is on its way to Earth and it was expected to arrive around that specific time. However, it can very well be that the coronal mass ejection is late and thus did not arrive yet meaning the geomagnetic conditions are still calm even though significantly more activity was expected. It is very hard to accurately predict the arrival time of a coronal mass ejection so it is not uncommon that coronal mass ejections arrive several hours after the predicted arrival time.

There is no difference between Kp5 and G1. NOAA uses a five-level system called the G-scale, to indicate the severity of both observed and predicted geomagnetic activity. This scale is used to give a quick indication of the severity of a geomagnetic storm. This scale ranges from G1 to G5, with G1 being the lowest level and G5 being the highest level. Conditions below storm level are labelled as G0 but this value is not commonly used. Every G-level has a certain Kp-value associated with it. This ranges from G1 for a Kp-value of 5 to G5 for a Kp-value of 9. The table below will help you with that.

G-scaleKpAuroral activityAverage frequency
G04 and lowerBelow storm level
G15Minor storm1700 per cycle (900 days per cycle)
G26Moderate storm600 per cycle (360 days per cycle)
G37Strong storm200 per cycle (130 days per cycle)
G48Severe storm100 per cycle (60 days per cycle)
G59Extreme storm4 per cycle (4 days per cycle)
If you want to have a good chance to see aurora during your vacation you need to find a location as close as possible to the auroral oval. The auroral oval is an area around the magnetic poles of our planet where aurora occurs the most often, even during quiet space weather conditions. This oval is not equally large at all times: during strong geomagnetic activity, this oval will expand down to lower latitudes which means the aurora can be seen from lower latitudes but this of course does not occur very often. When on vacation you want to have the best chance to see aurora even during quiet space weather of course and that means you will likely need to travel north. It’s all about location! The auroral oval is located at the following locations during low geomagnetic activity. Northern hemisphere: Alaska, northern Canada, southern Greenland, Iceland, northern Norway, northern Sweden, northern Finland and northern Russia. For the southern lights you will have to go to Antarctica.
Yes. If the aurora is strong enough, then it’s absolutely still possible to see this phenomenon during a full moon. We do have to note that moonlight is quite strong compared to aurora so weak aurora might be hard or even impossible to see. Especially for lower latitudes, we really want as little moonlight as possible to increase our odds of seeing aurora.
That is actually correct. During the weeks around the equinox (astronomical event in which the plane of Earth’s equator passes the center of the Sun) the aurora can be ever so slightly more active than at other times. Why this occurs isn’t fully understood yet but scientists believe that Earth’s tilt in some way favors enhanced geomagnetic conditions around the equinox.
Many cameras these days are capable of producing quality pictures of the aurora. However, there are a few things you need to think of if you are thinking of getting serious into the world of aurora photography. First you must get a camera that has a manual (M) mode. For aurora photography we want full control over the camera, as we are going to tell the camera exactly what it has to do for us. If you let the camera decide what settings it’s going to use than you will likely end up with a less than satisfying result. Second item you must get is a tripod as we are going to use slow shutter speeds. You cannot use a shutter speed of let’s say 10 seconds and hold the camera perfectly still by hand. You will move the camera even if you try your very best and come home with blurry pictures. So it’s very important to invest in a tripod! When it comes to lenses, kit lenses are often very much capable of producing nice pictures of the Aurora Borealis. If you have the money you can consider getting a wider and a faster (lower f-stop) lens so you can don’t have to expose as long but it is not vital. To reduce camera shake even more, a remote shutter release can be a very handy tool as well.
No, the Aurora Borealis and the Aurora Australis will not completely disappear during solar minimum but it’s appearance will be less frequent during solar minimum. Solar minimum is a period where very few sunspots appear on the Sun. Fewer sunspots means fewer solar flares and fewer coronal mass ejections being launched towards our planet. The normal solar wind will not disappear and coronal holes will still be present from time to time but they will appear less frequently near the equator and be smaller in size. While it is true that there are less geomagnetic storms during the years around solar minimum, the aurora will still be visible from time to time at high latitudes locations. Because there aren’t as many strong solar storms during solar minimum as during solar maximum, it will not happen very often that the auroral oval expands to lower latitudes but aurora will appear from time to time at locations close to the auroral oval, like northern Scandinavia and Alaska but perhaps not as frequent as during solar maximum.
No. The polarity of the interplanetary magnetic field and the north-south direction (Bz) of the interplanetary magnetic field are two very different things. While it is true that we speak of a negative Bz-value when the north-south direction of the interplanetary magnetic field turns southward it is in no way related to the polarity of the interplanetary magnetic field. The polarity of the interplanetary magnetic field is not important if you are only interested in knowing if there will be chance for aurora tonight. The north-south direction (Bz) of the interplanetary magnetic field is however a vital ingredient when it comes to auroral activity but this cannot be predicted. The north-south direction (Bz) of the interplanetary magnetic field is first known when it passes the DSCOVR satellite. From there it will take the solar wind only 30 to 60 minutes to arrive at Earth.
There are people who claim that they heard the aurora with their own ears during strong auroral activity but there is no solid evidence that aurora produces sound waves which the human ear could pick up. Auroral emissions occur so high up in the atmosphere (well above 50 miles/80 kilometers) and the air is so thin there, that even if the aurora produces sound waves, these waves would never be able to reach the surface of our planet.
Geomagnetically induced currents is the space weather term used to describe electricity flowing through the ground during a geomagnetic storm. Changing magnetic fields cause currents to flow in wires and other conductors. When the local magnetic field begins to vibrate, electricity begins to flow. Geomagnetically induced currents can cause voltage fluctuations in electrical grids and damage high-voltage power transmission transformers. This can in extreme cases cause an interruption of power supply. Long pipe lines are also susceptible. Geomagnetically induced currents can increase the rate of corrosion which reduces the service life of a pipeline.

Other questions

Earth has about 24 time zones. We say “about” because some countries or regions use local times that deviate half on hour from these zones. However, as soon as we talk about space weather or even science in general, there is really only one time that matters and that is the Coordinated Universal Time (UTC). You will find this time everywhere on our website. Use the map below te see the difference between the UTC time and the time zone that you are in. Click on the image to view a larger version.

Timezones

Image: Standard time zones of the world. Source: Wikimedia Commons.

Let’s work with some examples: imagine you are in Vancouver, Canada in the Pacific Standard Time time zone. According to the UTC time, it is 21 UTC. To convert the UTC time to our local time we have to subtract 8 hours from the UTC time. 21 minus 8 results in a local time of 13 PST. During daylight saving time (Pacific Daylight Time) we subtract 7 hours from the UTC time and that results in a local time of 14 PDT.

Let’s try again but this time we are in Amsterdam, the Netherlands. To convert 21 UTC to our local time we add 1 hour and that results in a local time of 22h. During daylight saving time we add 2 hours and that results in a local time of 23h.

Do keep in mind the date when converting UTC to your local time. We once again take Vancouver, Canada as an example: it currently is 14 November, 02h UTC time. This results in 18h on 13 November local time in Vancouver, Canada.

No. You might come across people out there who claim that the Sun is responsible for seismic and volcanic activity here on Earth but there is absolutely no scientific evidence that space weather and volcanic activity/earthquakes are related in any way. Dr. Keith Strong made this excellent video on his YouTube channel which is where he comes to exactly this conclusion.

About this website

All the data and information that we publish on SpaceWeatherLive can not be downloaded directly from our website. All of the information that we publish come from external sources that are freely accessible for everybody. If you are interested in certain data that we provide on SpaceWeatherLive we advise you to download it directly from the original source. The data on our website is always accompanied by a footnote that indicates from which website or institution the data came from. We also have a special page with handy links where we have a list of websites, many of which we use to get the data that we display on our website.
Yes. We have an app available for iOS and Android that brings you the familiar SpaceWeatherLive experience to your mobile device. The app has an integrated push notifications service, an app exclusive dark theme and is free to use for anybody. There are no (hidden) costs!

Latest news

Support SpaceWeatherLive.com!

A lot of people come to SpaceWeatherLive to follow the Sun's activity or if there is aurora to be seen, but with more traffic comes higher server costs. Consider a donation if you enjoy SpaceWeatherLive so we can keep the website online!

23%
Support SpaceWeatherLive with our merchandise
Check out our merchandise

Latest alerts

Get instant alerts!

Space weather facts

Last X-flare2024/02/22X6.3
Last M-flare2024/03/19M1.4
Last geomagnetic storm2024/03/03Kp6- (G2)
Spotless days
Last spotless day2022/06/08
Monthly mean Sunspot Number
February 2024124.7 +1.7

This day in history*

Solar flares
12003M5.34
22003M2.33
32000M2.29
42003M2.23
52003M2
ApG
1200137G3
2200638G2
3200219G1
4201526G1
5200511G1
*since 1994

Social networks